Abstract
Large language models (LLMs) have achieved remarkable success in natural language processing (NLP), demonstrating significant capabilities in processing and understanding text data. However, recent studies have identified limitations in LLMs’ ability to reason about graph-structured data. To address this gap, we introduce GraphEval36k, the first comprehensive graph dataset, comprising 40 graph data structure problems along with 36,900 test cases. Additionally, we introduce an evaluation framework based on GraphEval36k, designed to assess the graph reasoning abilities of LLMs through coding challenges. Our dataset categorizes test cases into four primary and four sub-categories, ensuring a comprehensive evaluation. We evaluate eight popular LLMs on GraphEval36k, revealing that LLMs exhibit a better understanding of directed graphs compared to undirected ones. While private LLMs consistently outperform open-source models, the performance gap is narrowing. Furthermore, to improve the usability of our evaluation framework, we propose Structured Symbolic Decomposition (SSD), an instruction-based method designed to enhance LLM performance on GraphEval36k. Results show that SSD improves the performance of GPT-3.5, GPT-4, and GPT-4o on complex graph problems, with the increase of 11.11%, 33.37%, and 33.37%, respectively.
Methodology
Pipeline

Figure 1: Overview of the Evaluation Framework. For each problem, we input problem statement, data examples, and code framework to LLMs. And then they complete the code and give explanations. Finally, the framework evaluates the code on GraphEval36k and returns the result details.

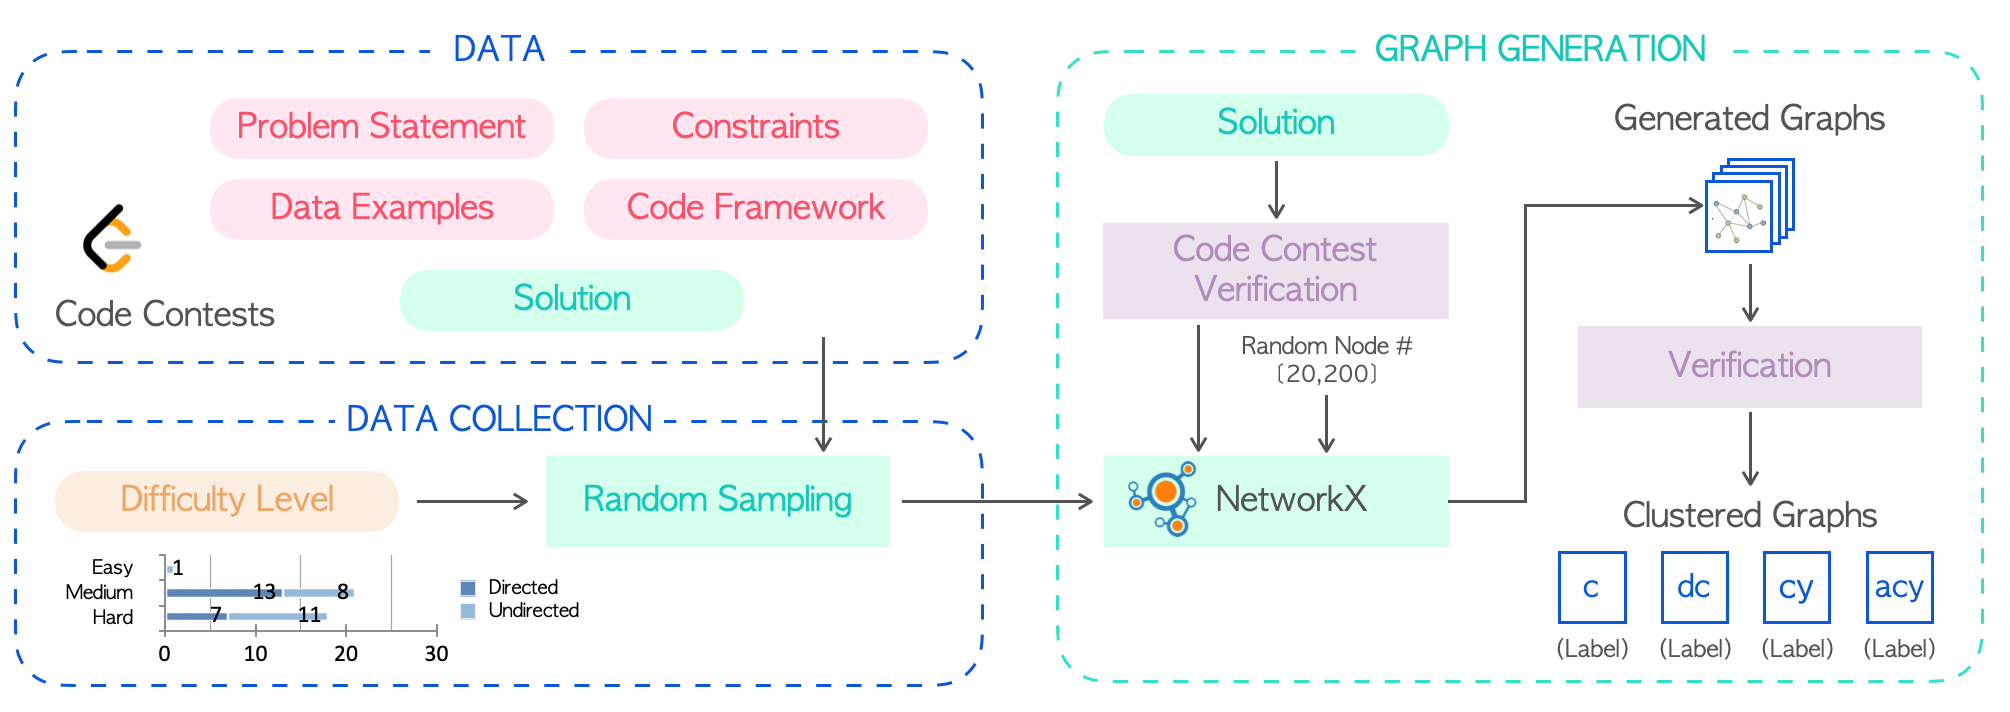
Figure 2: The overview pipeline of GraphEval36k dataset construction.
Graph Classifications

Figure 3: Distribution of graph problems on concepts and difficulty levels.

Figure 4: Structure of GraphEval36K. “U” denotes undirected graphs, “D” denotes directed graphs, with numbers indicating the count of cases in each category. The graphs are classified into eight main categories: sparse, planar, regular, dense, complete, Small-world, ErdosRenyi, and Power-law. Some are further divided into four sub-categories: connected, disconnected, cyclic, and acyclic. Sub-categories may vary based on the characteristics of the main categories.
Structured Symbolic Decomposition
To enhance the usability of our evaluation framework and GraphEval36k, we introduce Structured Symbolic Decomposition (SSD), an instruction-based method utilizing test cases from GraphEval36k for graph problems. Our approach aims to enable LLMs to perform better graph reasoning, especially, for hard-level problems.
Instructions for LLM
The instructions are composed of four parts: problem clarification, problem breakdown, solution formulation, and program implementation.
- Problem Clarification:
- Cognitive Step: You must first understand and clearly articulate the problem, including all inputs and desired outputs.
- Action Step: Identify and list any specific rules, constraints, or conditions that influence the solution. Use the test case examples to assist the understanding.
- Problem Breakdown:
- Cognitive Step: Decompose the problem into smaller, manageable sub-problems, translating it into a symbolic form and identifying the key components and relationships within the problem.
- Action Step: Outline the sequential steps required to solve the overall problem.
- Solution Formulation:
- Cognitive Step: Formulate solving strategies using the symbolic form developed in the previous step and define the algorithms and methods needed to address each sub-problem.
- Action Step: Detail the algorithms and approaches for each sub-problem, ensuring they are logically connected and comprehensive.
- Program Implementation:
- Cognitive Step: Conceptualize the implementation of each solution component.
- Action Step: Write a program for each breakdown part, ensuring it aligns with the formulated strategy. Run test cases to verify the correctness of each component.
Experiments

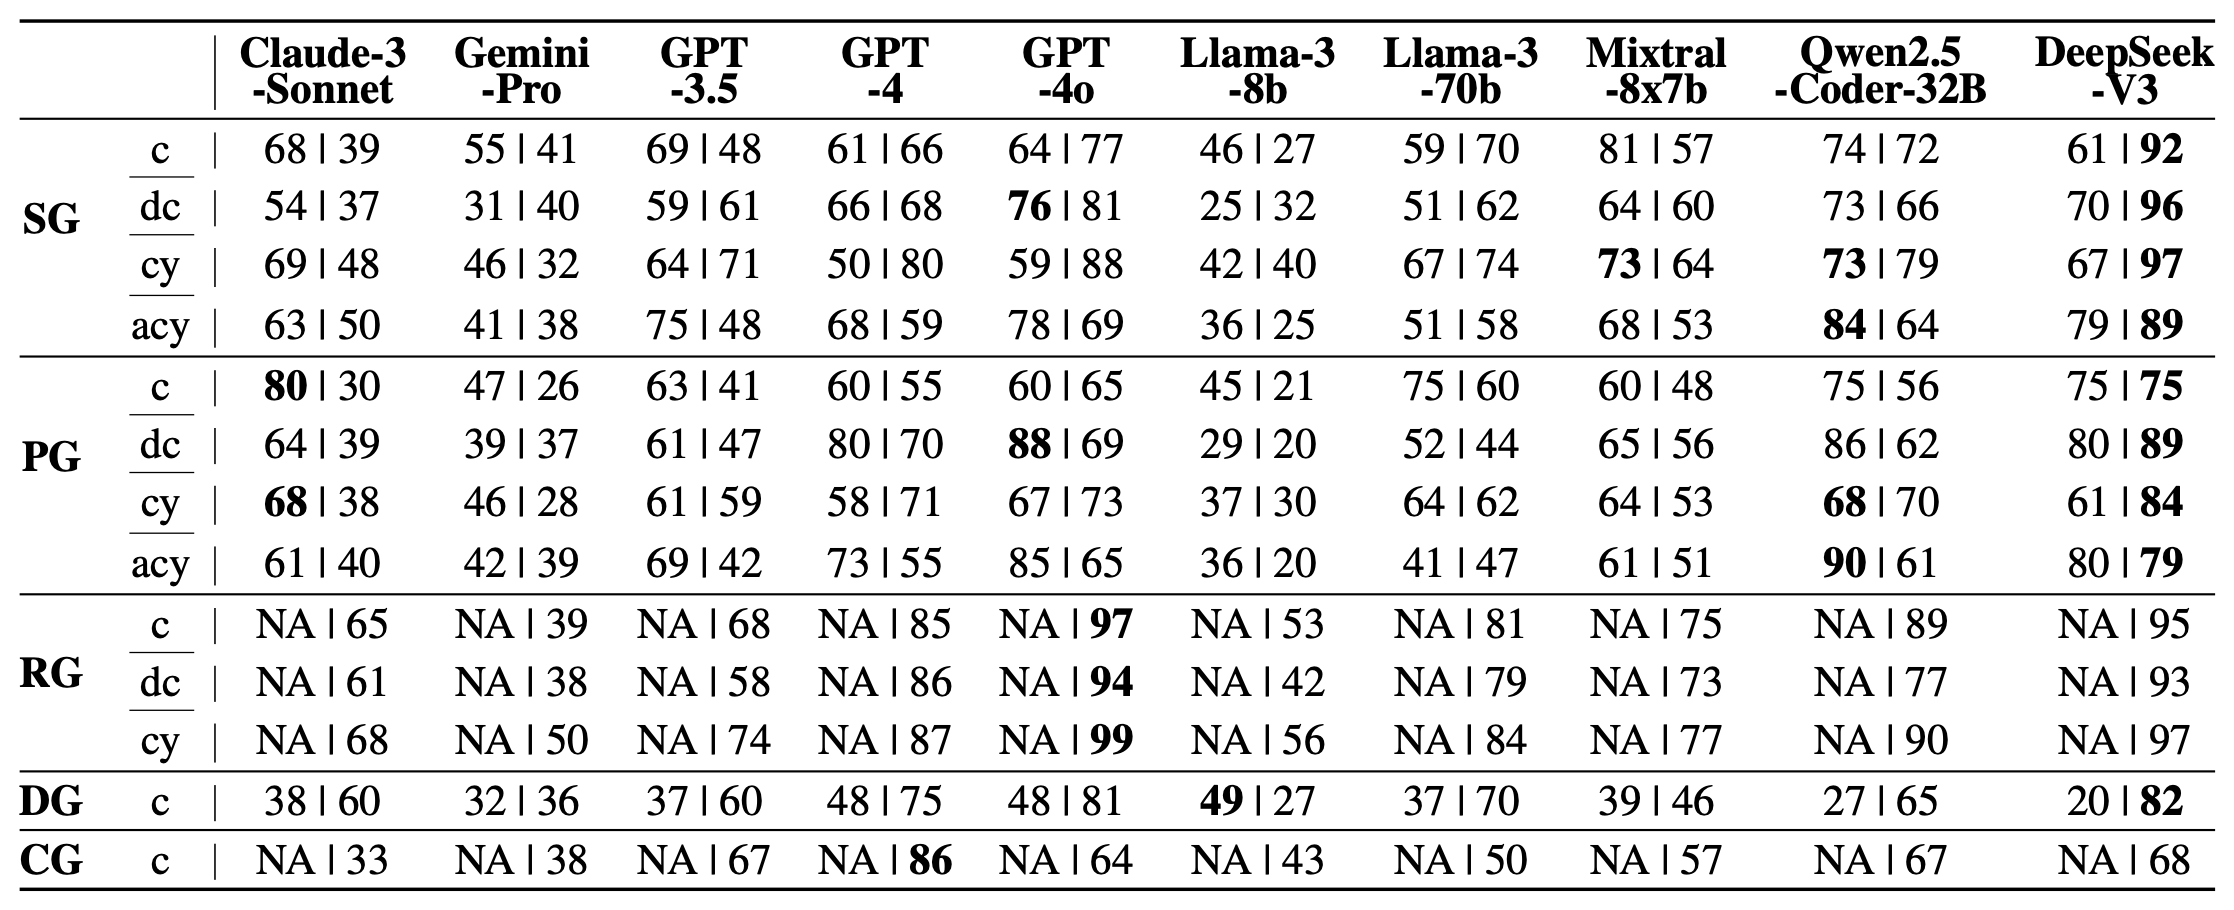
Table 2: Evaluation Results on GraphEval36K. Passing rates (%) of ten LLMs across graph categories. The first column categorizes graphs: “SG” (sparse), “PG” (planar), “RG” (regular), “DG” (dense), and “CG” (complete). Abbreviations include “c” (connected), “dc” (disconnected), “cy” (cyclic), and “acy” (acyclic). Results are shown as “Directed | Undirected” for each category, with “NA” indicating not applicable. Bold values highlight the highest passing rate per row.

Figure 6: Passing rate of LLMs on graph concepts. Part (a) presents the passing rate on easy concepts, and part (b) presents the passing rate on difficult concepts.

Figure 7: Evaluation results of LLM-generated code on complex graphs: Small-world, Erdos–Renyi, and Power-law.

Table 3: Passing rates of four LLMs (GPT-4, GPT-4o, Gemini-Pro, and Claude-3-Sonnet) across different graph problems and types of graph samples. We randomly sampled six problems, a total of 6,000 graph samples from our dataset, to compare model performance with and without (vanilla) the proposed SSD method.